06 Sep 2021 - {{hitsCtrl.values.hits}}
 Among the many tragic consequences of the COVID-19 pandemic, there have been some positive offshoots as well. One of them is the improvement of Colombo’s air quality as a result of restricted movement to prevent the spread of the disease.
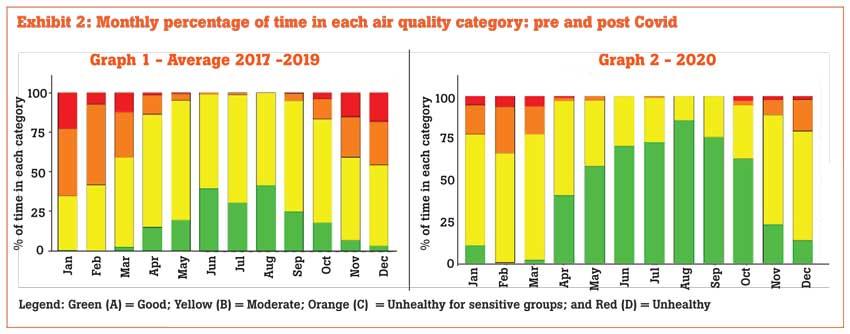
This Insight quantifies the improvements in air quality in Colombo during periods of COVID-19-related restrictions. The data in Exhibit 2 shows that the air quality in Colombo saw a marked improvement throughout the year and was especially improved during the normal four-month period of peak pollution connected to the Northeast monsoon from November to February. Monsoon patterns can dramatically improve air quality by sweeping away air pollution (Southwest monsoon – currently experiencing) or bring stable air masses (Northeast monsoon), which allows air pollution to remain in the atmosphere over Colombo.
 During this period, the duration of unhealthy air quality (or hours spent breathing air categorised as unhealthy) in Colombo reduced from an average of 53 percent to 22 percent. This equates to a 60 percent reduction in the time during which the air is unhealthy. Furthermore, the air quality improvement was especially significant during the daily periods of rush hour traffic.
To explain the data and findings, it is first necessary to set out how air quality is measured and how these measures are categorised.
Measuring and categorising air quality
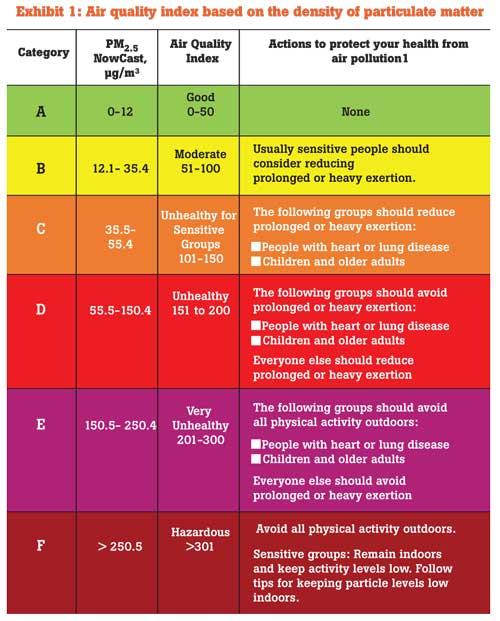
Many adverse health effects have been directly linked to air pollution consisting of fine inhalable particle matter that are 2.5 micrometres or smaller in diameter. This is what is referred to as PM2.5, which is the most widely measured air pollutant worldwide. (An average human hair is about 70 micrometres – about 30 times larger than PM2.5)
Exhibit 1 sets out the standard air quality index, which categories air quality in terms of related health warnings based on the density of PM2.5 (micrograms per cubic meter -- µg/m³).
Quantifying improvement in air quality
Monthly average duration for each category of air quality that was observed is set out in Exhibit 2. Sensors provide data on an hourly basis as micrograms per cubic meter - µg/m³, which is then translated into a (colour coded) health index – AQI (see Exhibit 1 above). Exhibit 2 below presents this data as the four colour coded bands for each month. The pre-COVID-19 average (years 2017, 2018 and 2019) is presented in graph 1 and graph 2 presents it for the following calendar year, 2020, capturing the commencement of the COVID-19-led slowdown in activity from March 2020. Most notable is the significant improvement in the percentage of ‘Good’ air quality (category A) in 2020, in the months of the Southwest Monsoon, when Colombo typically enjoys cleaner air.
Comparing peak air pollution period – November to February
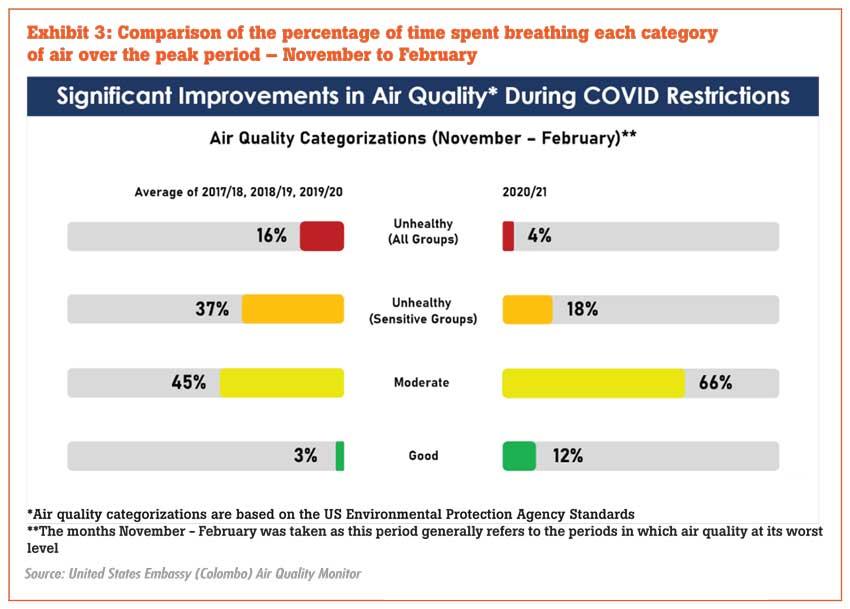
To quantify the COVID-19 clean-up of air quality in Colombo, we have focused on comparing the average air quality in the months November to February (usually the worst months for air quality in the city) from 2017 to 2020, against the air quality observed in November 2020 to February 2021.
The results are set out in Exhibit 3. In the pre-COVID period, the air was classified as unhealthy for 53 percent of the time – falling into categories C and D (unhealthy for sensitive people and all people, respectively). In contrast, during the period of COVID-19 restrictions, the air quality fell into these unhealthy categories for only 22 percent of the time. This is a 60 percent reduction in the average time that air quality was unhealthy.
Alternatively, from the perspective of the public that is breathing the air, this could be read as the probability of breathing unhealthy air in Colombo reducing by 60 percent during the period of COVID-19 restrictions. This improvement was seen to be greater among the categories of unhealthy air. Furthermore, during the period of COVID-19, a person was four times more likely to be breathing good quality air than in the pre-COVID-19 period.
Did traffic times drive improvement?
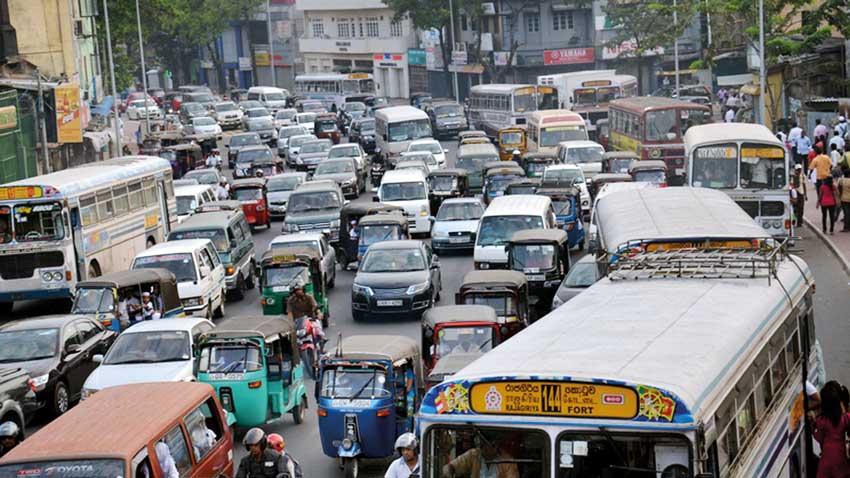
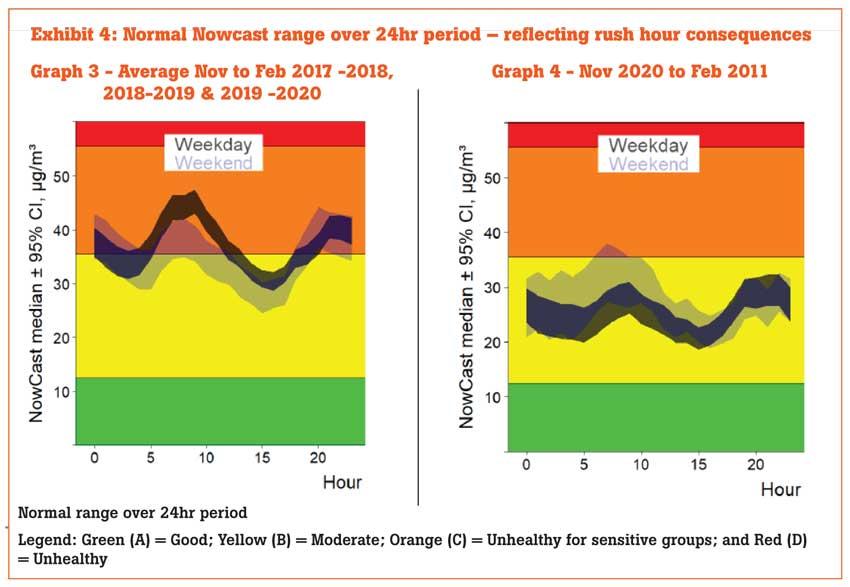
It is likely that the main contributor to air pollution in Colombo is the emissions from vehicles. Exhibit 4 shows the average air quality, measured by the density of PM2.5 in the air, for specific times of the day in a 24-hour period, for both prior to and during COVID-19 restrictions. This exhibit suggests that the air quality improved the most during weekday rush hour periods during COVID-19 restrictions. The improvement in air quality during these same times in the weekends were much less.
Conclusion
The Insight reveals the result of what was effectively a natural experiment – evaluating if the reduction of traffic could lead to improvements in air quality and by how much? The COVID-19-related movement restrictions allowed for data to quantify the change in air quality in Colombo in order to evaluate the question of a COVID-clean up. Overall, the COVID-19 restrictions seem to have led to a 60 percent reduction in the average duration of time that people in Colombo were exposed to air that was unhealthy.
(Verité Research is an independent think tank based in Colombo that provides strategic analysis to high level decision makers in economics, law, politics and media. Comments are welcome. Email [email protected])
Understanding air quality – basic pointers
1. Air quality is driven mainly by two factors in Sri Lanka
a. The level of emissions from various source points. For example, the more fossil fuels are burned for transport or energy, the more emissions there are in the air. To improve air quality, we need to target source points and present alternative policy solutions, which are already available but not effectively implemented.
b. The shift in the monsoon. The public is provided a reprieve from otherwise high levels of air pollution thanks to monsoon conditions. This is clearly demonstrated in Exhibit 2, where a significant improvement in Colombo’s air quality is seen between April/May and September/October each year. As such, the monsoon does help mask the air pollution problem.
2. What does the public need to know when interpreting air quality data?
a. The Air Quality Index (AQI) measured in µg/m³ translates into a (colour coded) health index, signifying the potential adverse impact to an individual’s health (see Exhibit 1).
b. The safeguard measures are relatively simple behavioural changes such as avoiding outdoor activity, closing the windows and wearing an approved mask e.g.N95. Additional measures can be taken in situations where air quality is in the unhealthy category or worse for prolonged periods. For example, in the United States, measures such as setting aside a room in the home with an air purifier is recommended during the bushfire season, so that occupants may retreat into the safe space until air quality improves.
17 Jun 2026 50 minute ago
17 Jun 2026 1 hours ago
17 Jun 2026 1 hours ago
17 Jun 2026 1 hours ago
17 Jun 2026 2 hours ago