26 Jan 2026 - {{hitsCtrl.values.hits}}
The Sri Lankan tea industry experienced an increase in Production, Exports whilst recorded a decrease in National Average for the period January to December 2025 compared to the corresponding period in 2024.
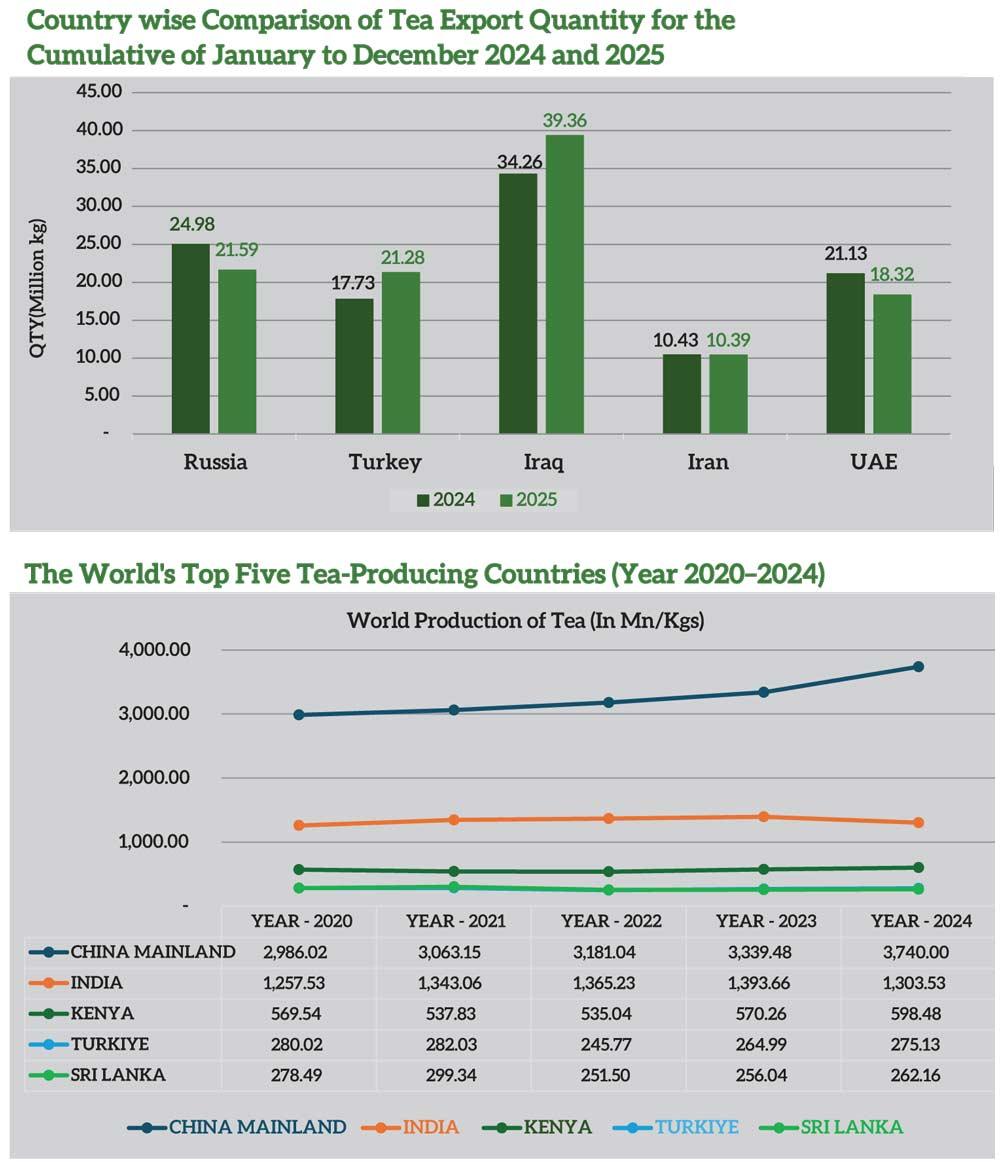
Iraq, Russia and Turkey continued with strong demand for Sri Lankan tea and were the top 03 importers for the period January to December 2025.
Macro-economic factors continued in fundamentally challenging the tea industry framework, with variations in supply and demand, currencies, and the political climate in importing countries.
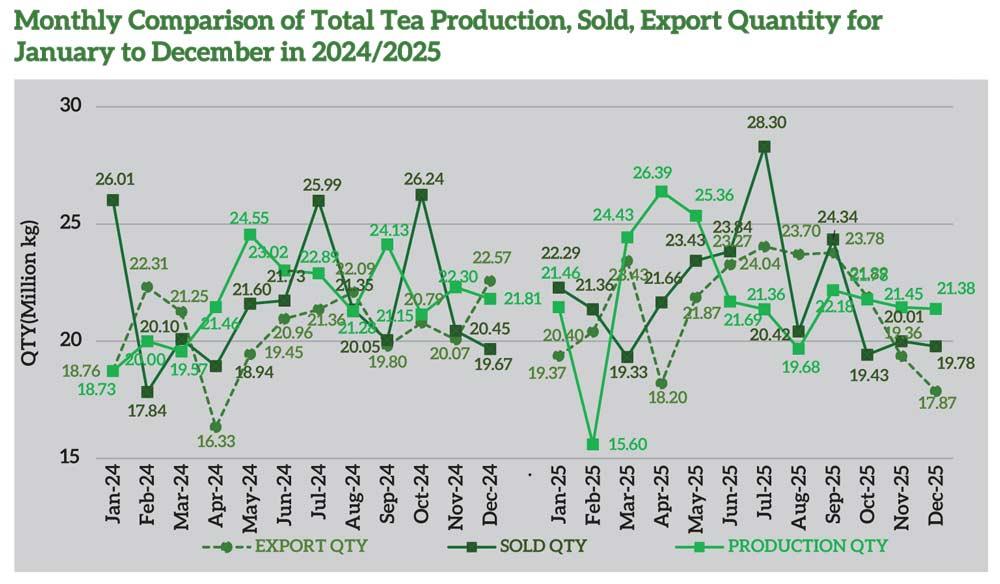
Total tea production of Sri Lankan Tea for the period January to December 2025 was 264.12 Mn/Kgs, as compared to 262.69 Mn/Kgs in 2024 (+1.43 Mn/Kgs). All three elevations recorded an increase in volume compared to the corresponding period last year.
Furthermore, the CTC Low Grown experienced a drop in volume, whereas High & Medium categories recorded an increase when compared to the corresponding period in 2024. Production & Exports showed an increase of +1.43 Mn/Kgs, and +11.65 Mn/Kgs respectively when compared to the corresponding period in 2024.
The total National Average of Teas sold for the period January to December 2025 was Rs.1,167.72 (USD 3.88) per kg in comparison to Rs.1,225.17 (USD 4.06) for the same period in 2024, which recorded a decrease of - Rs.57.45 in Rupee value and -USD 0.18 in Dollar Value. Low Growns averaged Rs.1,235.26 (USD 4.1); Mid Growns recorded Rs.1,025.82 (USD 3.41) with High Growns at Rs.1,100.86 (USD 3.66). All three elevations recorded a drop in Rupee and Dollar value when compared to the corresponding period in 2024.
Low Growns with the largest market share at 60.40% of production, recorded a decrease of -Rs.69.12. Meanwhile, High and Medium Growns recorded a drop of -Rs.40.77 and -Rs.38.66 respectively in comparison to the corresponding period in 2024.
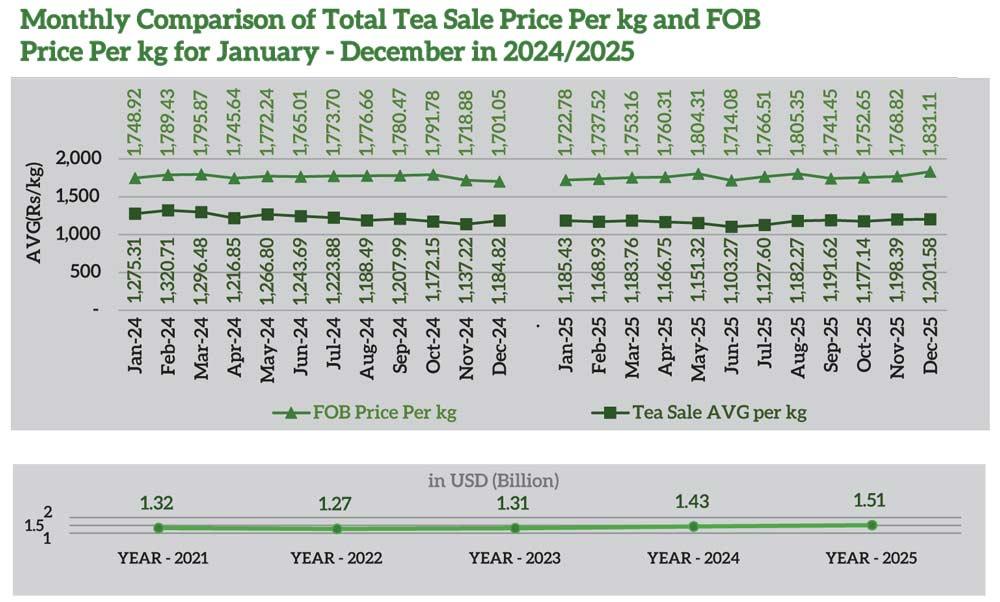
Sri Lanka Tea Exports for the period January – December 2025 amounted to 257.44 Mn/Kgs vis-à-vis 245.79 Mn/Kgs recorded for the same period last year (+11.65 Mn/Kgs). The FOB average price per kilo for this period stood at Rs. 1,760.70 (USD 5.85) in contrast to Rs. 1,763.61 (USD 5.84), which shows a decrease in the Rupee term (-Rs.2.91) and increase in Dollar value (+USD 0.01) when compared to the corresponding period in 2024.
The FOB value of Tea Bags has improved in comparison to the same period in 2024. The Total revenue realized for the period January – December 2025 from Tea Exports was Rs.453.28 Bn (USD 1.51Bn) compared with Rs.433.47 Bn (USD 1.43 Bn) recorded for the period January to December 2024. It’s an increase in Rupee term (+Rs. 19.80 Bn) and Dollar value (+USD 71.38 Mn) compared to the same period in 2024. Teas in Packets and Teas in bulk showed a decrease in FOB Value.
Iraq emerged as the top importer of Sri Lankan tea for January – December 2025, followed by, Russia and Turkey. Tea exports to Iraq increased by +5.10 Mn/Kgs, whilst exports to Russia dropped by +3.39 Mn/Kgs. Meanwhile, exports to the Turkey rose by +3.54 Mn/Kgs. Exports to Libya saw an increase of +8.64 Mn/Kgs and U.A.E recorded a drop of 2.81 Mn/Kgs.
In terms of the USD equivalent, based on the respective weighted average exchange rates, export earnings amounted to USD 1.51 Bn in 2025 comparison to USD 1.43 Bn in 2024, USD 1.31 Bn in 2023, USD 1.27 Bn in 2022, USD 1.32 Bn in 2021
China, the world’s largest tea producer, continued to dominate global production with a clear upward trend from 2020 to 2024. Tea Production increased steadily from 2,986.02 Mn/Kgs in 2020 to 3,063.15 Mn/Kgs in 2021, 3,181.04 Mn/Kgs in 2022, and 3,339.48 Mn/Kgs in 2023, reaching a peak of 3,740.00 Mn/Kgs in 2024. This consistent growth highlights China’s strong production capacity and expanding tea sector.
India, the second-largest producer, recorded relatively stable production levels with minor fluctuations during the period. Production rose from 1,257.53 Mn/Kgs in 2020 to 1,343.06 in 2021 and 1,365.23 in 2022, peaking at 1,393.66 Mn/Kgs in 2023. However, a slight decline was observed in 2024, with output falling to 1,303.53 Mn/Kgs.
Kenya’s tea production showed moderate variations over the five years. After recording 569.54 Mn/Kgs in 2020, production declined to 537.53 in 2021 and 535.04 in 2022. It then recovered to 570.26 Mn/Kgs in 2023 and further increased to 598.48 Mn/Kgs in 2024, indicating a strong rebound.
Türkiye’s tea production remained moderately stable, peaking at 282.03 Mn/Kgs in 2021. Production declined to 245.77 Mn/Kgs in 2022 but recovered slightly to 264.99 Mn/Kgs in 2023, followed by a further increase to 275.13 Mn/Kgs in 2024.
Sri Lanka experienced a decline in tea production over the period. Production increased from 278.49 Mn/Kgs in 2020 to 299.34 in 2021. However, it dropped sharply to 251.50 Mn/Kgs in 2022. Although a slight recovery was seen in 2023 (256.04 Mn/Kgs) and 2024 (262.16 Mn/Kgs), production remains below earlier levels.
Overall, the data reflects diverse trends among major tea-producing countries. China shows consistent growth, Kenya demonstrates recovery and expansion, while Sri Lanka continues to face production challenges. These patterns highlight the varying strengths and constraints within the global tea industry.
21 Jun 2026 7 hours ago
21 Jun 2026 9 hours ago
21 Jun 2026 21 Jun 2026
21 Jun 2026 21 Jun 2026
21 Jun 2026 21 Jun 2026