Reply To:
Name - Reply Comment
Last Updated : 2024-04-19 19:28:00
28 April 2017 10:09 am - 1 - {{hitsCtrl.values.hits}}

The aim of Sustainable Development Goal 1 (SDG 1) is to eradicate extreme poverty and to reduce all forms and dimensions of poverty, at least by half, by the year 2030. As such, this article looks at the status of poverty in Sri Lanka, based on different poverty lines, both national and global.
The estimates are based on the ‘Household Income and Expenditure Survey-2012/13’ (HIES-12/13), conducted by the Census and Statistics Department, the latest data set available at present. The analysis examines the status of poverty at national, sectoral and district levels, as well as by different population groups based on the occupation or activity of the head of the household (groups are given in Table 2).
Information on poverty estimated using different poverty lines, which measures income poverty, multidimensional poverty, extreme poverty based on global poverty lines, etc., could be useful to those involved in developing strategies to achieve SDG 1.
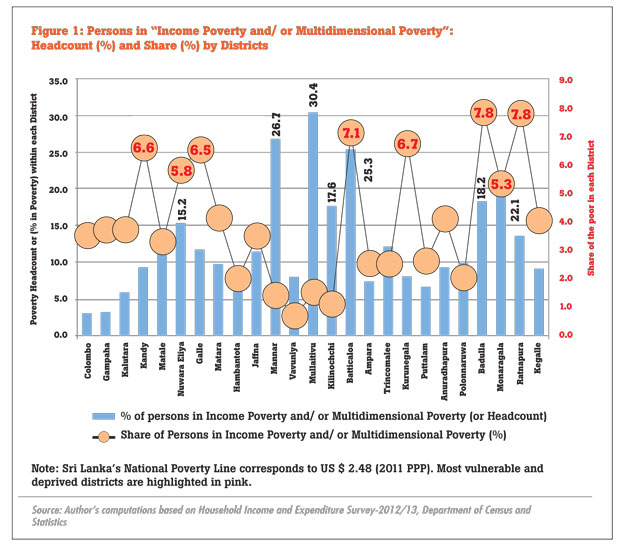
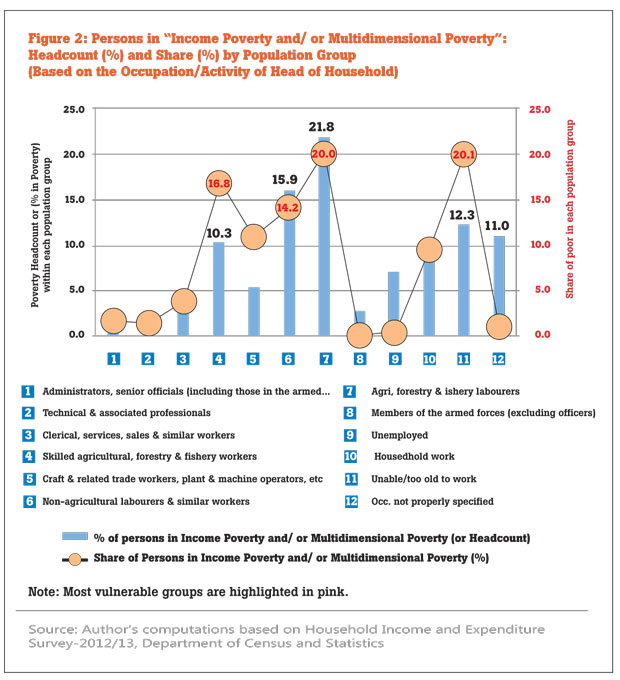
It is important to note that both the poverty headcount (or the percentage of poor within a region/population group) and share (out of the total) in each region/population group, need to be considered when developing strategies to reduce poverty everywhere in the country.
Status of poverty based on different measures of poverty
The income poverty (IP), which is measured using the national poverty line (NPL), declined from 26.1 percent in 1990/91 to 6.7 percent (or 1.34 million persons) in 2012/13 (columns 2 and 3, Table 1). Although Sri Lanka has made considerable progress in reducing the IP, estimates show that a large number of persons are living just above the NPL.
For example, if the NPL (which was Rs.3,624 per person per month in 2012/13) is increased by 10 percent, the poverty headcount will increase to 9.9 percent, which accounts for 2.0 million persons, indicating that there are more than 620,000 persons within the 10 percent above the NPL.
The Multidimensional Poverty Index (MPI) measures acute poverty and the overlapping deprivations faced by the members of the households in relation to education, health and living conditions. Analysis show that 791,874 (or 4.0 percent) of the people in Sri Lanka are in multidimensional poverty (columns 4 and 5, Table 1 and 2).
Another 2.2 million (or 11.2 percent) people are ‘near multidimensionally poor’ (columns 6 and 7, Tables 1 and 2). This indicates that quite a large number of persons are still at risk of slipping back to poverty.
As the poor and near poor could easily get affected due to various economic shocks and/or weakening of any of the other three dimensions, education, health and living conditions, it would be more appropriate to look at persons who are in ‘income poverty and/or multidimensional poverty’, which covers all dimensions of poverty. This is especially important, as SDG 1 also envisages reduction of all forms and dimensions of poverty, everywhere. There are 1.8 million persons (or 9.3 percent) who are in ‘IP and /or multidimensional poverty’ (columns 8 and 9, Tables 1 and 2).
To measure extreme poverty, the global poverty line US $ 1.25 a day (2005 PPP) was being used until October 2015. Since then the World Bank and United Nations agencies have introduced a new poverty line – US $ 1.90 a day (2011 PPP) to measure extreme poverty, soon after the declaration of SDGs in September 2015.
They also changed the lines used to measure ‘moderate poverty’, from US $ 2.00 a day (2005 PPP) to US $ 3.10 a day (2011 PPP). The World Bank claims that poverty headcounts computed using these new poverty lines, should not make much of a difference, compared to those estimated using the previously used lines for ‘extreme poverty’ and ‘moderate poverty’.
However, it does not seem to hold true for a country like Sri Lanka, which is getting closer to transforming into a ‘upper-middle-income country’ (columns 10 and 12, Tables 1 and 2), as the extreme poverty headcounts have almost halved under the new poverty line (US $ 1.90 a day), compared to the previous poverty line (US $ 1.25 a day).
Similarly, based on US $ 2.00 a day, 3.9 million (or 19.6 percent) persons were in moderate poverty in 2012/13, while the corresponding estimate based on the new poverty line – US $ 3.10 a day, is 2.9 million (or 14.6 percent). These differences are too large to be disregarded. Due to this reason and the fact that these global poverty lines do not take the multiple dimensions of poverty into consideration, it is far more appropriate to use the combination of the IP measured using the NPL and multidimensional poverty (Columns 6, fig. 1 and 2), which covers income, as well as other dimensions of poverty, when developing strategies to reduce poverty in the country.
Regional variations and variations between population groups
The two tables provide a clear picture of the variations, between regions, as well as between the different population groups. However, only the highlights are given in this short article. Out of the IP persons, nearly 87 percent and out of extreme poor persons (US $ 1.90 a day, poverty line) almost 90 percent are in the rural sector.
On the other hand, the poverty headcount is highest in the estate sector. For example, poverty headcount within the estate sector (column 8, Table 1), for ‘income poverty and/or multidimensional poverty’, is high (25 percent), because MDP is high (17.9 percent) in this sector (column 4, Table 1).
This is mainly due to inadequate access to safe drinking water and safe sanitation, in the estate sector. Out of the districts, Batticaloa is the poorest, in terms of both poverty headcount and share of poor, followed by Monaragala. Other districts with high shares of poor persons are Badulla, Ratnapura, Kurunegala, Kandy, Galle and Nuwara Eliya. Although the Mullaitivu District has the highest incidence of poverty (or poverty headcount), followed by Mannar District, the shares of the poor persons (out of the total), in these districts are very low, due to low population densities in these districts.
Among the population groups, persons living in households headed by ‘Agricultural, forestry and fishery labourers’ are the poorest, followed by those in households headed by ‘Non-agricultural labourers and similar workers’, ‘Those unable or too old to work’ and ‘Skilled agriculture, forestry and fishery workers’ (Table 2). Out of those who are in ‘income poverty and/or multidimensional poverty’, 70 percent are in households headed by the above four groups.
Summary and broad recommendations
This analysis clearly shows that there are considerable regional variations and variations between population groups.
To eradicate extreme poverty and to reduce poverty in all its dimensions, effective strategies will have to be developed, which will ensure that those who manage to escape poverty, will not get slipped back to poverty. Those in extreme poverty and most vulnerable may need to be supported through precisely targeted social protection programmes, until they are in a position to stand on their own.
If the programmes like ‘Samurdhi’ are not properly targeted to cover the most deserving and vulnerable, it will not be possible to eradicate extreme poverty. When developing strategies to reduce poverty, the highest priority need to be given to, elimination of child poverty, which could lead to intergenerational poverty cycle, as it is necessary to break the poverty trap. The results of the HIES-2016 will provide the latest estimates on income poverty. An in–depth analysis of the new survey data could provide the latest estimates of poverty based on different poverty lines. Such estimates will be extremely useful as the baseline information required to monitor the progress of SDGs, which came into effect in January 2016.
(Wimal Nanayakkara is a Senior Visiting Fellow at the Institute of Policy Studies of Sri Lanka (IPS). To view this article online and to share your comments, visit the IPS Blog ‘Talking Economics’ - http://www.ips.lk/talkingeconomics/)
Sunil Gamage Thursday, 12 March 2020 11:13 AM
I would suggest the author of the figures, to review this data or the presentation format. Those engaged in farming, there are two types. 1. FARMERS - or what you mentioned Skilled workers? 2. unskilled agriculture farmers. My survey information in 2017 shows that 78% of the farmers are below the poverty line

Add comment
Comments will be edited (grammar, spelling and slang) and authorized at the discretion of Daily Mirror online. The website also has the right not to publish selected comments.
Reply To:
Name - Reply Comment

On March 26, a couple arriving from Thailand was arrested with 88 live animal
According to villagers from Naula-Moragolla out of 105 families 80 can afford
Is the situation in Sri Lanka so grim that locals harbour hope that they coul
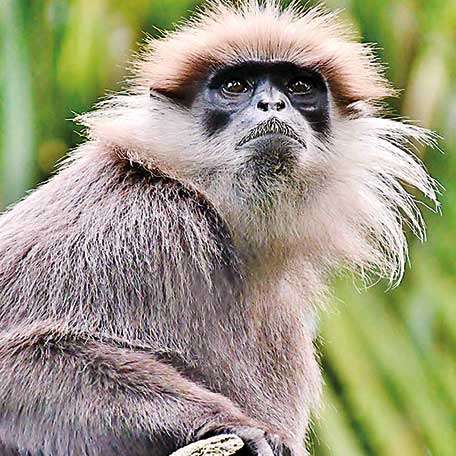
A recent post on social media revealed that three purple-faced langurs near t