
Reply To:
Name - Reply Comment
Last Updated : 2024-04-24 22:26:00
17 June 2020 08:42 am - 0 - {{hitsCtrl.values.hits}}

 Given the stark choice between saving lives with no certainty vs saving livelihoods with some certainty, Sri Lanka, like some other countries, opted for the former and acted early. Would this wreak havoc in the Sri Lankan economy?
Using a forward-looking econometric methodology that combines estimates from pre-crisis data with calibrated estimates for the COVID-19 impact, this exercise tries to shed some light on what to expect by 15 major sectors of the Sri Lankan economy.
This is not a forecasting exercise. Instead, the methodology that accounts for sectoral interdependence generates not only the direct growth impact on a sector from the ‘COVID-19 sentence’ but it also generates the indirect growth impact propagated by other sectors. It is these indirect effects that prolong the downturn in many sectors. One sector cannot recover fully in isolation.
Under the optimistic scenario, if the COVID-19 pandemic withers away and normalcy returns before the end of the year, a V-shaped or U-shaped recovery is likely for all the sectors. Some sectors, however, may take more than two years to fully recover. This is too much of a drag and calls for effective policy interventions to expedite the recovery process.
Under the less likely pessimistic scenario, where the COVID-19 outbreaks linger on, the economy would go into an L-shaped drag. The growth numbers by sector indicate that GDP in 2020 alone may contract by about 4.3 percent. The very objective of these warning lights is not to realise the bad outcome.
Introduction
It was a choice between saving lives vs saving livelihoods under enormous uncertainties. Some countries tried to do both initially and failed. Some countries, including Sri Lanka, opted to save lives first. Many countries, including Sri Lanka, for no other choice, were forced to adopt somewhat blindfolded measures to control the spread of the coronavirus disease (COVID-19) though at a heavy cost to their economies and the global economy in general.
International institutions like the World Bank (2020), International Monetary Fund (2020) and International Labour Organisation (2020) have already provided warnings on the economic fallout of the pandemic. Opinion pieces also abound. It suffices to say that the social and economic despair caused by the pandemic at the global scale is likely to be unprecedented.
In the optimistic scenario, the pandemic may wither away completely, before the end of the year, like the SARS episode did in 2003. In the pessimistic scenario, the pandemic may linger on for a long time with waves of varying amplitudes and duration. The severity and duration of the economic downturn that Sri Lanka has faced will be known much later only when the official statistics are out.
Nevertheless, it is worth assessing what to expect. The objective of this exercise is to provide a quantitative assessment of the growth impact on 15 major sectors of the Sri Lankan economy, under these two scenarios. Such prior analyses and early warnings are of immense value to policymakers in steering the economy away from the potential danger zones.
At the outset, it should be emphasised, however, that prior indicators should not be assessed against the actual outcomes because the very objective of early warnings is not to realise the bad outcome.
Methodology
This type of analysis requires forward-looking methodologies instead of those that rely only on past data. In less-technical terms, the key aspects of the methodology are the following.
1. The econometric model consists of 15 regression equations, one for each sector. The sectors are all interdependent. The intervention variable is the COVID-19 shock, represented by a binary dummy variable.
2. The sectoral growth interdependence among the 15 sectors is estimated from pre-crisis data. The parameter estimates for the intervention variable are calibrated.
3. In addition to the COVID-19 intervention variable, the model uses two other exogenous variables, export-share weighted GDP of Sri Lanka’s trading partners (FORGDP, for foreign GDP) and visitor arrivals (VISITOR). These two variables are used in estimating the parameters from pre-crisis data and for obtaining sectoral forecasts for calibrating the intervention parameters.
4. The calibration is done by first forecasting each sector value-added growth for the first three quarters of 2020 and then estimating the parameters of the COVID-19 dummy for 2020 1Q, 2Q and 3Q by running another regression for each sector.
5. After obtaining all the parameter estimates (285 in total), the growth effects of the COVID-19 shock are estimated by deriving what are known as impulse responses. These growth effects indicate what to expect from 2020 1Q onwards over 16 quarters or four years.
Data
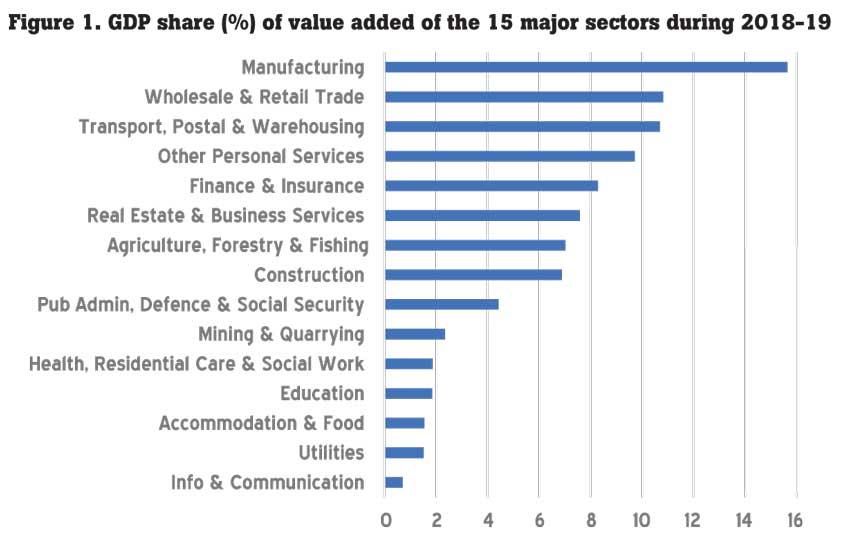
Quarterly value-added data (at constant prices) over the period 2010 1Q-2019 4Q by major sectors and sub-sectors are provided online in the Census and Statistics website Department. Figure 1 shows the 15 major sectors ranked by the average GDP share during 2018-19.
The manufacturing sector is the largest with a GDP share of 15.6 percent and information and communications sector is the smallest, with a GDP share of 0.7 percent. In contrast, manufacturing is the smallest sector in Hong Kong that resulted over the years because of industrial hollowing out. Singapore, however, tries to sustain the prominence of the manufacturing sector.
Information and communications sector in Sri Lanka is relatively very small; this sector in Hong Kong accounts for 3.3 percent of GDP and in Singapore 4.1 percent.
The utilities sector that includes electricity, gas and water supply and waste management is typically a small sector in terms of value-added because these services are essential and not run on a commercial basis.
In Sri Lanka, the accommodation and food services sector that includes hotels and restaurants is also small with a GDP share of 1.6 percent, whereas in Hong Kong, this sector’s contribution to GDP is 3.1 percent and in Singapore 2.1 percent. This reflects the smallness of Sri Lanka’s tourism sector.
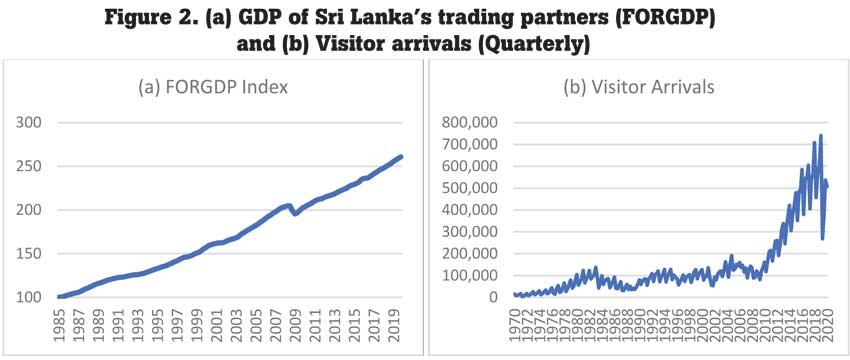
Figure 2 plots the two exogenous variables in the model, (a) FORGDP index and (b) visitor arrivals. FORGDP is derived from the export-share weighted GDP growth rate of Sri Lanka’s trading partners (61 economies, including the rest of the world). The sharp drop of the variable in 2009 is a result of the global financial crisis.
For the sake of information, quarterly visitor arrivals are plotted since 1970. Visitor arrivals are highly seasonal with peaks occurring in December and January.
What is important to notice is that during the LTTE war period (1983-2009) tourism hovered below 200,000 per quarter and picked up noticeably only after the war ended in 2009. The impact of the Easter bombing on April 21, 2019, is also clearly visible in the graph.
We need to forecast these two variables for the first three quarters of 2020, in order to calibrate the COVID-19-related parameters of the model. Although we can set forecast values for VISITOR growth with some certainty, generating forecasts of FORGDP growth is anybody’s guess.
Given the extreme uncertainties that prevail, it would be best to use a non-informative prior (as in the Bayesian analysis) and set a uniform contraction of FORGDP growth in every quarter of 2020. Nevertheless, based on the preliminary information coming from other countries, we set FORGDP to -1 percent growth in 1Q.
For the next two quarters, we set -3 percent growth. These are obviously too conservative numbers. Visitor data for 2020 1Q are available and shows an 18.1 percent drop over the previous quarter. For 2020 2Q and 3Q, it is safe to assume zero visitor arrivals because of travel restrictions and fear of travel.
Results
Regression estimates
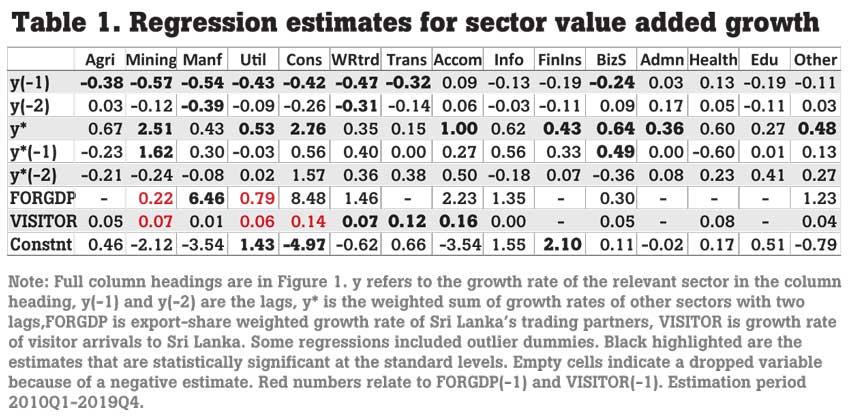
Regression estimates based on data over 2010 1Q-2019 4Q are shown in Table 1. Estimates highlighted in black are statistically significant at the standard levels. The short sample period may be the reason for insignificance of some other estimates. The key observations from the estimates are the following.
1. Most noteworthy are the estimates for y* (weighted sum of growth rates of the sectors, excluding the sector in column heading). They are all positive and the sum of the coefficients of y*, y*(-1), y*(-2) is also positive. This indicates that sectoral interdependence is strong and reinforcing. Mining and quarrying and construction show the strongest dependence on other sectors.
2. Growth of Sri Lanka’s trading partners (FORGDP) is highly conducive to the growth of the manufacturing sector. Although the construction sector coefficient is larger, it is not statistically significant. FORGDP is also important for a number of other sectors.
3. Interestingly, growth of visitor arrivals (VISITOR) seems benefit many sectors. Visitor expenditure would have shown a much stronger effect. The sectors that do not pick up any direct effect from visitor arrivals are finance and insurance, public administration and health. Nevertheless, there is an indirect effect as shown in Figure 3 later. As expected, the sector that is most affected by a drop in visitor arrivals is accommodation and food (hotels and restaurants) followed by transportation and wholesale and retail trade.
4. Most of the autoregessive coefficients (those of y(-1) and y(-2) are negative. This is because quarterly growth rates tend to fluctuate a lot compared to annual growth rates.
COVID-19 impact: Impulse response (growth effect) analysis
The key objective of this exercise to assess sectoral growth outlook under the two scenarios mentioned earlier, optimistic and pessimistic.
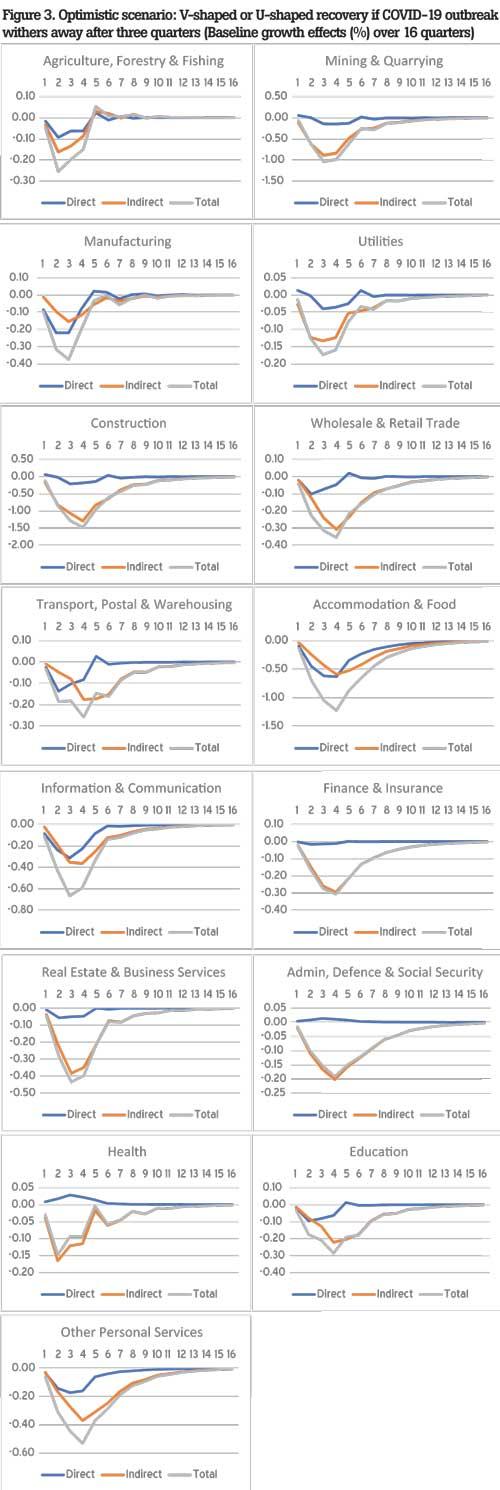
Figure 3 presents the results under the optimistic scenario, where we assume that the COVID-19 outbreak withers away by the end of the third quarter of 2020.
The baseline numbers in Figure 3 are in percent – percentage point responses to one percentage point growth shock (COVID-19 shock). These numbers can be multiplied by a desired number to magnify the effect.
Multiplying by 10 seems to produce numbers that are more in line with the growth forecasts that we generated to calibrate the parameters.
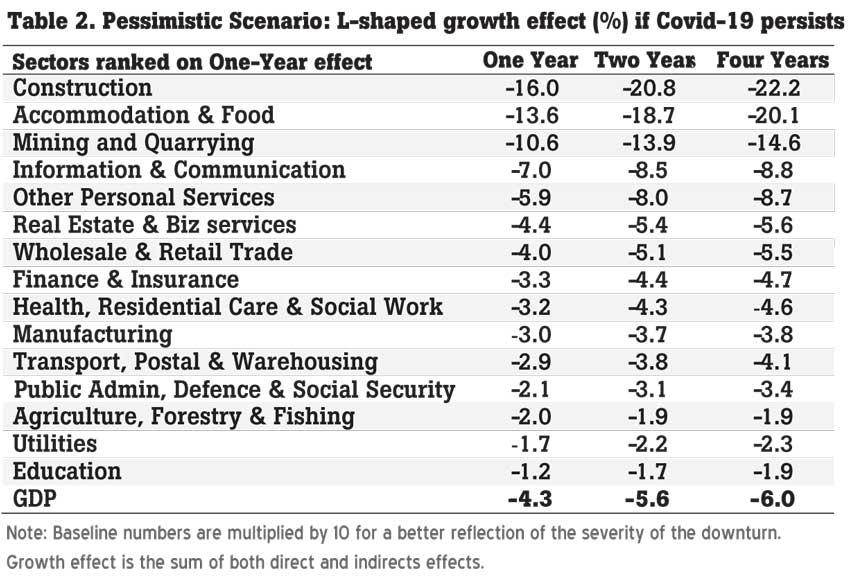
These results are presented in Table 2, under the pessimistic scenario, where the COVID-19 pandemic lingers on for a long time. One important advantage of this analysis is that it can generate not only the direct growth impact of COVID-19 on a sector but also the indirect impact coming through other sectors.
In contrast, the numbers in Table 1 pick up only the direct impact. Results in Figure 3 and Table 2 lead to the following observations.
1. Under the optimistic scenario, if normalcy returns by the end of 2020 third quarter, a V-shaped or U-shaped recovery is likely for all the sectors. However, the duration varies from sector to sector. In the absence of effective policy interventions, full recovery even under the optimistic scenario may take more than two years. This is too much of a drag and calls for effective policy interventions to expedite the recovery process.
2. It is the indirect growth effect that drags many sectors into the prolonged downturn. For example, accommodation and food (hotels and restaurants) sector, as expected, is severely affected directly because of travel restrictions. But the indirect effect from other sectors propels a further drag as time goes by. A similar situation seems to occur in manufacturing and transportation and storage sectors as well. Basically, one sector cannot recover fully in isolation.
3. Curiously, the indirect effect seems to be nearly the sole driver of the downturn in finance and insurance, public administration, defence and social security and health sectors.
4. Numbers in Table 2 are quite suggestive on the growth impact in 2020 (column under ‘one year’). A large contraction in the accommodation and food sector is easy to understand. Why the construction sector indicates a large contraction is difficult to explain. In general, the construction sector in many countries is subject to their own dynamics and this type of model may not capture such dynamics well. The sectors that are least affected appear to be education, agriculture, forestry and fishing, utilities and public administration, defence and social security. This is not a surprising result, given the essential nature of these sectors.
5. GDP growth for 2020 indicated by the numbers in Table 2 is -4.3 percent. But this outcome can be changed with effective policy interventions.
6. Under the pessimistic scenario, which is less unlikely, the economy will go into an L-shaped drag as shown by the numbers in Table 2, under columns ‘two years’ and ‘four years’.
Concluding remarks
The key findings from the COVID-19 growth impact analysis are summarised above in the section ‘COVID-19 impact: Impulse response (growth effect) analysis’ and not repeated here. Instead, it is worth drawing attention to a couple other aspects.
First, although a V-shaped or U-shaped recovery is likely for all the sectors, the question is the duration of the downturn. Expediting the recovery process requires policy interventions.
Rich countries have already earmarked huge sums of money for stimulating their economies. In the case of Sri Lanka, already faced with the problem of public debt sustainability, stimulating the economy through fiscal means or otherwise, is a question open for discussion.
Second, it is a common belief that the corona pandemic is going to create major shifts in the global economic structure. The nature of structural shifts is uncertain at this stage. Therefore, such unknown shifts cannot be modelled easily.
Nevertheless, the early warning lights through this type of analyses are helpful in designing corrective actions and even structural shifts.
(Prof. Tilak Abeysinghe is Research Director of the Gamani Corea Foundation, Sri Lanka and a former Professor of Economics at the National University of Singapore)

Add comment
Comments will be edited (grammar, spelling and slang) and authorized at the discretion of Daily Mirror online. The website also has the right not to publish selected comments.
Reply To:
Name - Reply Comment

US authorities are currently reviewing the manifest of every cargo aboard MV

On March 26, a couple arriving from Thailand was arrested with 88 live animal

According to villagers from Naula-Moragolla out of 105 families 80 can afford

Is the situation in Sri Lanka so grim that locals harbour hope that they coul