Reply To:
Name - Reply Comment
Last Updated : 2024-04-25 22:46:00
17 September 2015 02:36 am - 0 - {{hitsCtrl.values.hits}}

.jpg) 1.2 Second Quarter - 2015
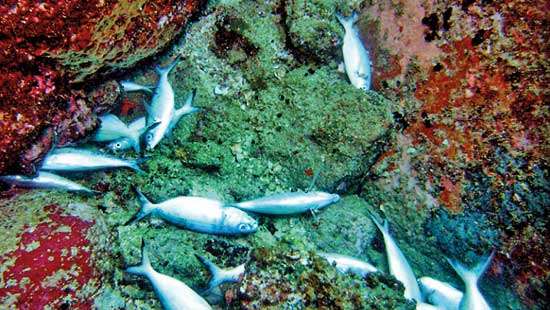
1.2 Second Quarter - 2015.jpg) The sub activities in Agriculture, which reported higher growth rates compared to the second quarter of 2014 are ‘Growing of cereals (except rice)’ by 24.0 percent, ‘Growing of rice’ by 66.2 percent. In addition ‘Growing of vegetables’, ‘Growing of fruits’, ‘Growing of oleaginous fruits including coconut’, ‘Growing of spices, aromatic, drug and pharmaceutical products’ and ‘Marine fishing and marine aquaculture’ increased slightly by 3.9 percent, 3.8 percent, 4.3 percent, 2.0 percent and 7.5 percent respectively in the second quarter of 2015.
The sub activities in Agriculture, which reported higher growth rates compared to the second quarter of 2014 are ‘Growing of cereals (except rice)’ by 24.0 percent, ‘Growing of rice’ by 66.2 percent. In addition ‘Growing of vegetables’, ‘Growing of fruits’, ‘Growing of oleaginous fruits including coconut’, ‘Growing of spices, aromatic, drug and pharmaceutical products’ and ‘Marine fishing and marine aquaculture’ increased slightly by 3.9 percent, 3.8 percent, 4.3 percent, 2.0 percent and 7.5 percent respectively in the second quarter of 2015..jpg)
.jpg)
.jpg) Movements of CCPI and GDP Implicit Price Deflator from first quarter of 2010 to second quarter of 2015 are shown in figure 6. GDP implicit price deflator which measures the price change in the economy with respect to a specific base year (2010=100), increased to 132.05 in the second quarter of 2015 from 127.96 in the second quarter of 2014 recording a 3.20 percent of inflation rate for the second quarter of 2015.
Movements of CCPI and GDP Implicit Price Deflator from first quarter of 2010 to second quarter of 2015 are shown in figure 6. GDP implicit price deflator which measures the price change in the economy with respect to a specific base year (2010=100), increased to 132.05 in the second quarter of 2015 from 127.96 in the second quarter of 2014 recording a 3.20 percent of inflation rate for the second quarter of 2015..jpg)
.jpg)
.jpg)

Add comment
Comments will be edited (grammar, spelling and slang) and authorized at the discretion of Daily Mirror online. The website also has the right not to publish selected comments.
Reply To:
Name - Reply Comment
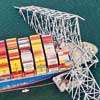
US authorities are currently reviewing the manifest of every cargo aboard MV

On March 26, a couple arriving from Thailand was arrested with 88 live animal

According to villagers from Naula-Moragolla out of 105 families 80 can afford

Is the situation in Sri Lanka so grim that locals harbour hope that they coul