Tue, 19 Mar 2024 Today's Paper

Child poverty: Who are the poorest children in Sri Lanka?

By

30 July 2015 06:30 pm - 0     - {{hitsCtrl.values.hits}}

A A A


The UN General Assembly adopted the following definition of child poverty, on January 10, 2007 – “Children living in poverty are deprived of nutrition, water and sanitation, access to basic healthcare services, shelter, education, participation and protection and that while a severe lack of goods and services hurts every human being, it is most threatening and harmful to children, leaving them unable to enjoy their rights to reach their full potential and to participate as full members of the society.” 

As the definition points out, measuring child poverty can no longer be lumped together with general poverty assessments, which often focus solely on income levels. It is also necessary to take into consideration, the access to basic social services, such as education, healthcare facilities, safe drinking water and sanitation, proper housing, etc. 


To get a broader picture of child poverty, this article provides a brief analysis that looks at not only the children (under five years and under 18 years) living in Income Poor (IP) households, but also those living in multi-dimensionally poor (MDP) households.  Multi-dimensional Poverty Index (MPI) is an index of acute multi-dimensional poverty that has three dimensions: health, education and living standards. These are measured by 10 indicators, which cover most of the aspects included in the above definition of child poverty, except the last two on participation and protection. 
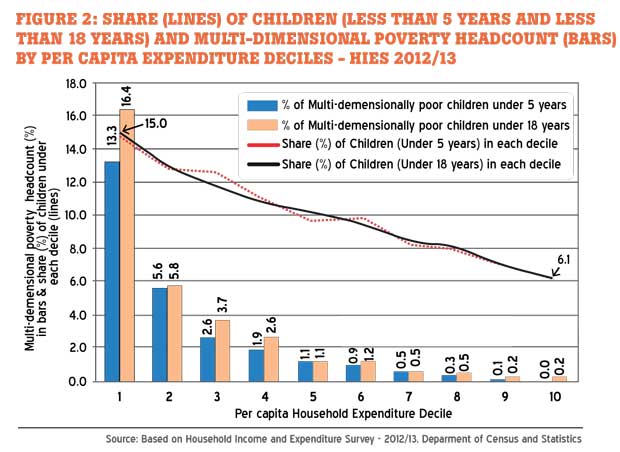
Measuring MDP is too complex to be explained in a brief article of this nature (HDR Technical Notes, provide details on the latest methodology, recommended by the UN to measure MDP). According to the UN recommendations, only the people/children living in households facing a weighted sum of more than 33.3 percent of a combination of the deprivations are considered to be MDP. Households facing 20 percent to 33.3 percent deprivations, out of the 10 deprivations, are considered to be ‘Near poor’. 


In this analysis only the former is considered due to the limitations in the length of the article. However, in addition to the children living in IP and MDP households, the analysis also looks at non-poor children (those not living in IP or MDP households) but who still face some of the deprivations, such as, not having access to safe drinking water/sanitation facilities, not attending school, etc., to draw the attention of the relevant authorities to the fact that there are children in the non-poor groups also, who are deprived of certain basic needs. 

This article will only look at the total picture of incidence of child poverty at national level. However, as there are considerable regional variations, which need the attention of planners and policymakers, an analysis showing the regional picture will be published later.

Out of 1.7 million children under five years and out of 6.2 million children under 18 years, 10.6 percent and 11.0 percent respectively, were either Income Poor and/or Multi-dimensionally Poor in 2012/13. Out of a total of 1.7 million children under five years, 8.7 percent were IP, 3.5 percent were MDP and 1.6 percent were both IP and MDP. As such, altogether 10.6 percent of the children under five were either IP, MDP or both IP and MDP (Figure 1).
Out of 6.2 million children under 18 years, 8.6 percent were IP and 4.3 percent were MDP. In this age group, 1.9 percent were both IP and MDP and as such, 11.0 percent were either IP, MDP or both IP and MDP.

Further analysis shows that even some of the non-poor children (who are neither IP nor MDP), are also facing deprivations in some of the basic needs, such as safe drinking water and/or safe sanitation, although they do not get classified as poor, though they may be in the near poor category. Out of the 1.5 million non-poor children under five years (who are neither IP nor MDP), 10.5 percent do not have access to safe drinking water and 15.8 percent do not have access to safe sanitation. Out of the 5.5 million non-poor children under 18 years, 9.8 percent do not have access to safe drinking water and 13.9 percent do not have access to safe sanitation. 

The share of children in poorer households is very much higher than the share in richer households, confirming that poorer families have more children than the richer families. The share of children (under five years, as well as under 18 years) in first ‘Per Capita Expenditure Decile’ (or the poorest 10 percent of the households) is 15 percent, while the corresponding share in the richest decile (or richest 10 percent) is only around 6.0 percent (Figure 2). 

Multi-dimensional Poverty Headcount is the highest for both children under five years (13.3 percent), as well as those under 18 years (16.4 percent), in the first per capita expenditure decile. Headcounts or percentage of children in poverty, decline down to less than 6 percent in the second per capita expenditure decile and continue to decline further, thereafter, showing that only the children in the poorest three to four per capita expenditure deciles are  affected by MDP in Sri Lanka (Figure 2).

Who are the poorest children in Sri Lanka? 
It is important to identify, children belonging to what types of Socio-Economic Groups (SEGs) are most vulnerable and poorest. For this purpose, the households were classified into 12 Socio-Economic Groups, based on the occupation or the activity of the head of the household (as given in Figure 3). The children in households affected by ‘IP, MDP or both IP and MDP’, were considered together (in-order to make the analysis simpler), to identify the SEGs to which the poorest and most vulnerable children (under 18 years) belong. 

The poorest children in Sri Lanka are from households headed by (i) agricultural labourers, (ii) non-agricultural labourers, (iii) persons who are unable to or too old to work and (iv) skilled agricultural and related workers: There are four SEGs that stand out above others. The poverty headcount (IP and MDP combined) is the highest for children (under 18 years) in households headed by ‘agricultural, forestry and fishery labourers’ (26.1 percent), followed by children in households headed by ‘non-agricultural labourers and similar workers’ (19.1 percent). The other two SEGs with high poverty headcounts for children, are households headed by ‘persons unable to or too old to work’ (15.7 percent) and by ‘skilled agricultural, forestry and fishery workers’ (12.4 percent). 

Out of 682,000 poor children under 18 years, the highest shares of poor children are in households headed by ‘agricultural, forestry and fishery labourers’ (23.3 percent), followed by children in households headed by ‘non-agricultural labourers and similar workers’ (16.4 percent), ‘skilled agricultural, forestry and fishery workers’ (16.0 percent) and ‘those unable to or old to work’ (13.3 percent).  Altogether, almost 70 percent of the poor children (under 18 years) are in these four SEGs. In addition to this, 12.7 percent of the poor children are from the households headed by ‘craft and related trade workers, plant and machinery workers’.
Children not attending school: Sri Lanka has almost achieved Universal Primary Education, net enrolment rate reaching 99.7 percent and almost 100 percent of pupils who enter Grade 1 reaching Grade 5. In addition, more than 98 percent of the children aged 11-14 years are also attending school, confirming the effectiveness of making education compulsory for children up to the age of 14 years.  

However, it is observed that after the age of 14 years, some children are dropping out of school education and that they do not attend any other educational institute, as well. Overall, 152,000 (or 16.0 percent) of the 984,000 children (15-17 years) are not attending school or any other educational institute. 
The percentages (within each SEG) of children (15-17 years) not attending school are high in five of the SEGs: Children in households headed by (i) ‘agricultural, forestry and fishery labourers’ (26.0 percent), (ii) skilled agricultural, forestry and fishery workers’ (19.7 percent), (iii) ‘those engaged in Household work’ (19.6 percent), (iv) ‘non-agricultural labourers & similar workers’ (18.2 percent) and (v) ‘those who are unable to or too old to work’ (17.5 percent).  Out of all the children not attending school in this age group, 71.3 percent are from these five SEGs. In addition to this, another 16.8 percent are from households headed by ‘craft and related trade workers’, ‘plant and machine operators’.

Among the estimated 106,900 poor children in this age group, around 34,700 (or 32.5 percent) are not attending school. Out of them, more than 88.0 percent are from the above five SEGs, indicating that the poor children (15-17 years) who are not attending school are mainly from those groups. As observed, it is not only the poor children who are not attending school, in these SEGs. As such, special attention will be needed regarding the children from these socio-economic groups.


Summary
1.    Out of 6.2 million children under 18 years, 682,000 (or 11.0 percent) are either ‘Income Poor and/or Multi-dimensionally Poor’.
2.    Poorer families have more children than the richer families: share of the children under 18 years in the poorest 10 percent of the households is 15 percent, while the share in the richest 10 percent is only 6 percent. As such, child poverty rates are higher than the rates for the entire population. 
3.    The poorest children in the country are from households headed by ‘agricultural labourers’, ‘non-agricultural labourers’, persons who are ‘unable to or too old to work’, ‘skilled agricultural and related workers’ and ‘craft and related trade workers, plant and machinery workers’.  82.7 percent out of the 682,000 poor children are from these five SEGs.
4.    Out of the 5.5 million non-poor children under 18 years, 9.8 percent do not have access to safe drinking water and 13.9 percent; do not have access to safe sanitation. 
5.    Out of 984,000 children (15-17 years),  152,00 (or 16.0 percent) are not attending school  and more than 88 percent of them are from SEGs under 2 above and from households headed by those engaged in household work.
6.    Any interventions to minimize child poverty or to provide access to safe drinking water and safe sanitation, reduce school dropouts, etc., will need to be focused mainly on the above indicated SEGs.
(Wimal Nanayakkara is a Senior Visiting Fellow at the Institute of Policy Studies of Sri Lanka (IPS). To view this article online and share your comments visit http://www.ips.lk/talkingeconomics/)  

Order Gifts and Flowers to Sri Lanka. See Kapruka's top selling online shopping categories such as Toys, Grocery, Kids Toys, Birthday Cakes, Fruits, Chocolates, Clothing and Electronics. Also see Kapruka's unique online services such as Money Remittence,Astrology, Courier/Delivery, Medicine Delivery and over 700 top brands. Also get products from Amazon & Ebay via Kapruka Gloabal Shop into Sri Lanka

  Comments - 0

Order Gifts and Flowers to Sri Lanka. See Kapruka's top selling online shopping categories such as Toys, Grocery, Kids Toys, Birthday Cakes, Fruits, Chocolates, Clothing and Electronics. Also see Kapruka's unique online services such as Money Remittence,Astrology, Courier/Delivery, Medicine Delivery and over 700 top brands. Also get products from Amazon & Ebay via Kapruka Gloabal Shop into Sri Lanka

Add comment

Comments will be edited (grammar, spelling and slang) and authorized at the discretion of Daily Mirror online. The website also has the right not to publish selected comments.

Reply To:

Name - Reply Comment


Order Gifts and Flowers to Sri Lanka. See Kapruka's top selling online shopping categories such as Toys, Grocery, Kids Toys, Birthday Cakes, Fruits, Chocolates, Clothing and Electronics. Also see Kapruka's unique online services such as Money Remittence,Astrology, Courier/Delivery, Medicine Delivery and over 700 top brands. Also get products from Amazon & Ebay via Kapruka Gloabal Shop into Sri Lanka

MIRROR CRICKET

More